Data Analyst Roadmap for Beginners in 2026: What to Learn, Practise and Build
Follow a practical learning order, complete one useful output at every stage and move from raw data to a documented beginner analytics project.
Excel, SQL, Power BI and Python are not four separate boxes to tick. Each tool solves a different part of an analytics problem. The real challenge for a beginner is knowing which one to learn first, what output to create and when to move to the next stage.
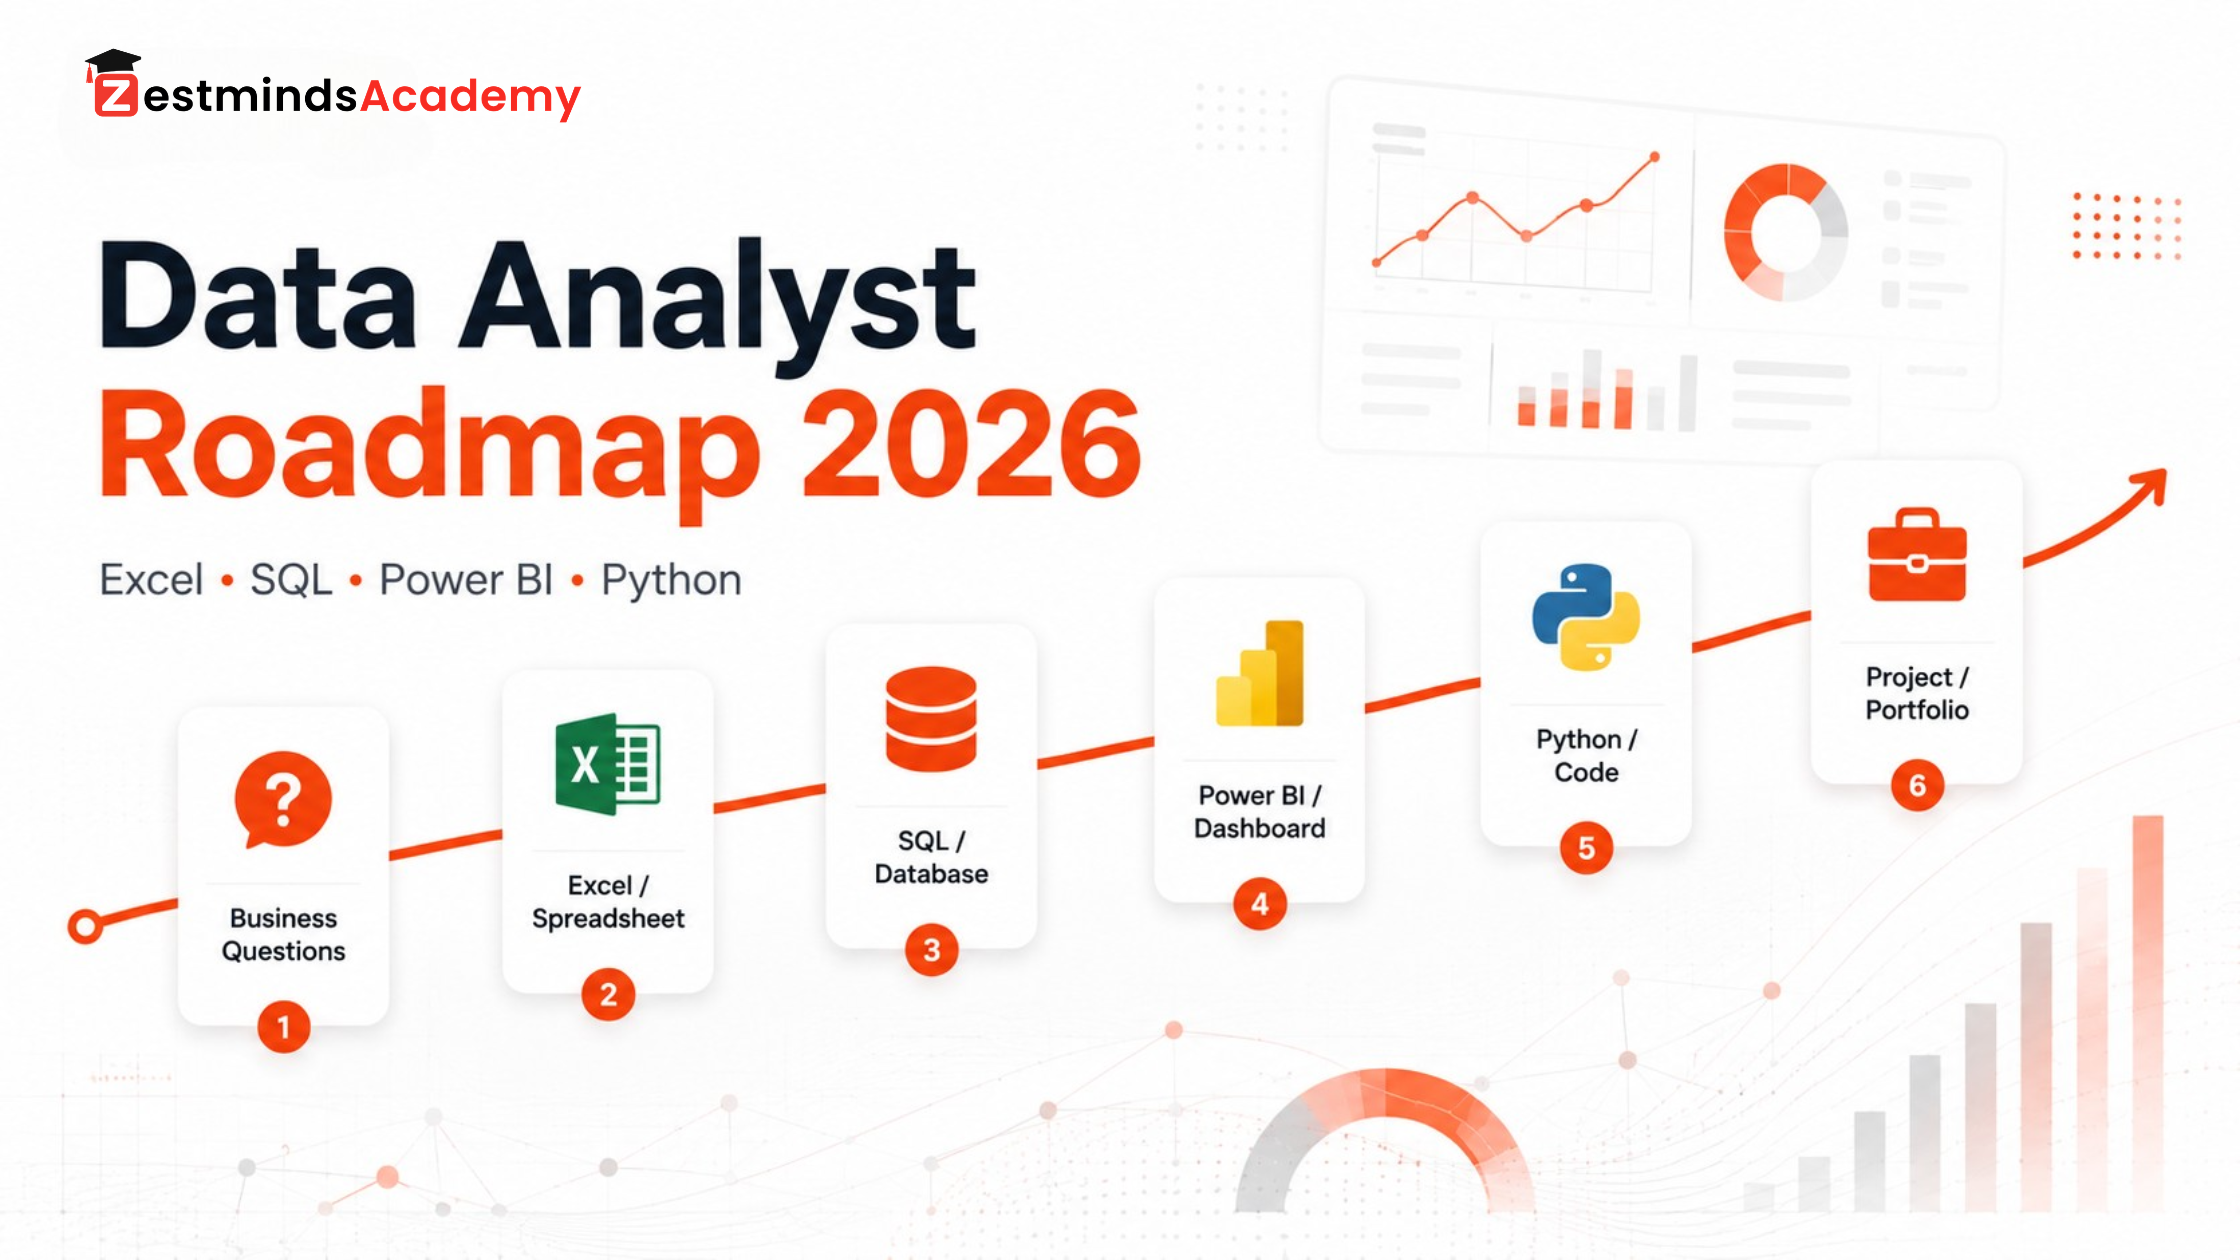
This Data Analyst roadmap for 2026 takes you from asking useful business questions to cleaning data, writing queries, building dashboards, analysing files with Python and completing one documented project. It is designed for students, freshers, non-technical learners and career switchers who want a clear path instead of another list of tools.
If Python is completely new to you, keep the Python roadmap for beginners as a companion for Stage 4. Follow the analytics stages in order instead of opening several unrelated resources at once.

Why the Learning Order Matters
Many beginners start several tutorials together. They learn a few Excel formulas, watch SQL JOIN videos, copy a Power BI dashboard and begin Python syntax because another roadmap says it is compulsory.
The result is often familiarity without independence. The learner recognises the tools but cannot open a new dataset and decide:
- What question should be answered?
- Which columns are useful?
- What needs to be cleaned?
- Which calculation is correct?
- Which visual explains the result?
- What should be written as the final insight?
The goal is not to collect tools. The goal is to use data to answer a useful question and explain the answer clearly.
You also do not need to complete every tool before starting a project. A better approach is to create one small output at each stage and gradually connect those outputs into a complete analysis.
What Does a Data Analyst Actually Do?
A data analyst does more than create charts. The work usually begins with a business or operational question and ends with an explanation that helps someone make a better decision.
- Understand the question.
- Identify the data required.
- Check data quality.
- Clean incorrect, missing or duplicate records.
- Calculate useful metrics.
- Compare periods, products, customers or locations.
- Create a report or dashboard.
- Explain the findings and limitations.
- Recommend the next action or investigation.
Imagine a retail manager says, “Revenue increased this month, but profit did not. Why?” The analyst should not immediately open Power BI and add charts. The first step is to investigate whether discounts increased, lower-margin products sold more, average order value declined or one location affected the result.
A Simple Exercise Before Opening Any Tool
Use a retail dataset containing order date, product, category, city, quantity, price, discount, revenue and profit. Write five questions before opening Excel, SQL, Power BI or Python:
- Which month generated the highest revenue?
- Which category produced revenue but weak profit?
- Which city had the lowest average order value?
- Did larger discounts increase order volume?
- Which products declined compared with the previous period?
This habit teaches you to begin with the problem rather than the software.
Data Analyst Roadmap 2026 at a Glance
| Stage | Main Focus | Practical Output | Move Forward When |
|---|---|---|---|
| Stage 0 | Business and data foundations | Five useful questions from a dataset | You understand what should be measured |
| Stage 1 | Excel | Cleaned report with formulas, pivots and charts | You can summarise spreadsheet data accurately |
| Stage 2 | SQL | Queries that answer business questions | You can filter, group and connect tables |
| Stage 3 | Power BI | Dashboard with KPIs and written insights | You can model data and explain visuals |
| Stage 4 | Python and Pandas | Repeatable analysis of monthly files | You can clean and transform data programmatically |
| Stage 5 | Project integration | Documented end-to-end portfolio project | You can explain the problem, process and result |
This sequence is flexible. A learner who already knows programming may begin Python earlier. A complete non-technical beginner may spend longer on foundations and Excel. The important point is to build a usable capability before adding another tool.
Stage 0 — Start with Business Questions and Data Foundations
Before learning software, understand how a dataset is organised and what it can or cannot tell you.
Concepts to Understand
- Row: One transaction, person, order or event.
- Column: One property of that record.
- Metric: A measurable value such as revenue, cost or order count.
- Dimension: A category used to group data, such as city, month or product.
- Missing value: Information that was not recorded.
- Duplicate record: The same event appearing more than once.
- Data type: Whether a value is text, a number, a date or another format.
- KPI: A metric selected to measure an important objective.
You should also be comfortable with totals, averages, percentages, percentage change, ratios, minimums, maximums and counts. Advanced mathematics is not required at the beginning, but basic numerical reasoning is important.
Foundation Practice Using the Retail Dataset
- Explain what one row represents.
- Identify which columns are metrics and which are dimensions.
- Check for missing dates, product names or prices.
- Look for repeated order IDs.
- Write five questions the dataset can answer.
- Write two questions it cannot answer because the required data is missing.
Readiness Check
- Can you explain what each row represents?
- Can you identify missing, inconsistent or duplicate data?
- Can you separate metrics from categories?
- Can you write a question the dataset can answer?
- Can you explain why the result may matter?
Stage 1 — Learn Excel for Cleaning, Calculations and Reporting
Excel is a practical starting point because you can see the raw data, calculations and final report in one place. It helps beginners understand how records change during cleaning and how formulas connect to summaries.
Excel Skills to Learn
- Sorting and filtering
- Date and number formatting
- Removing verified duplicates
- Handling blank cells
- IF, SUMIF and COUNTIF
- XLOOKUP
- Text and date functions
- Excel tables
- Pivot tables
- Basic charts
- Power Query introduction
Do not try to memorise every formula. Learn a formula when a task requires it, and verify that the output is correct.
Practical Excel Assignment: Retail Sales Report
- Keep the original dataset in a raw-data sheet.
- Create a separate cleaned-data sheet.
- Correct inconsistent dates and number formats.
- Review duplicate order IDs before removing them.
- Calculate revenue, profit and average order value.
- Create a monthly summary and category-level pivot table.
- Add two charts that answer defined questions.
- Write three findings below the report.
A number without context is not an insight. “Revenue was ₹10 lakh” becomes useful only when you explain whether it increased, declined, met a target or depended heavily on one category.
Excel Readiness Check
- Can you clean a spreadsheet without manually editing every row?
- Can you choose a formula based on the question?
- Can you create and refresh a pivot table?
- Can you verify the report totals?
- Can you explain what each chart shows?
Stage 2 — Learn SQL to Ask Questions from Structured Data
Business data is often stored across related database tables. SQL helps you retrieve, filter, group and connect that information.
SQL Skills to Learn
- SELECT
- WHERE
- ORDER BY
- DISTINCT
- COUNT, SUM and AVG
- GROUP BY
- HAVING
- INNER JOIN and LEFT JOIN
- CASE WHEN
- Subqueries and common table expressions
- Basic window functions after the foundations are stable
Do not judge SQL progress by how many commands you remember. Judge it by whether you can turn a written question into a correct query and validate the result.
Practical SQL Assignment: Orders, Customers and Products
Split the retail data into related tables for customers, orders, order items and products. Then answer questions such as:
- Which customers placed more than five completed orders?
- What was the monthly revenue and profit?
- Which city had the highest average order value?
- Which categories received the largest average discount?
- Which registered customers have not placed an order?
Before writing each query, identify the required tables, their relationship, the necessary filters and how you will check the result. Add a short comment above every saved query explaining the question it answers.
SQL Readiness Check
- Can you translate a written question into a query?
- Can you identify the required tables and columns?
- Can you choose the correct JOIN?
- Can you explain why duplicate rows appeared?
- Can you validate totals against a known source?
Stage 3 — Learn Power BI for Data Modelling, Dashboards and Insights
Power BI helps you prepare, model and communicate data. A useful dashboard requires more than dragging fields into charts. It needs clean data, correct relationships, meaningful measures and a clear audience.
Power BI Skills to Learn
- Importing Excel, CSV and database data
- Power Query transformations
- Data types and cleaning
- Table relationships
- Basic data modelling
- Measures and introductory DAX
- KPI cards, filters and slicers
- Chart selection
- Report-page layout
- Written insight and interpretation
Microsoft describes Power Query as a data preparation and transformation engine. Use the official Power Query overview when you need to understand how imported data can be reshaped before analysis.
Practical Power BI Assignment: Retail Performance Dashboard
Use the cleaned retail dataset and create a dashboard for a business manager. Include only the information needed to answer the original questions:
- Total revenue and profit
- Total orders
- Average order value
- Monthly trend
- Category performance
- City performance
- Discount and profit comparison
Weak observation: The North region generated ₹8 lakh in revenue.
Better insight: The North region generated the highest revenue, but most of it came from one category. A decline in that category could affect the region’s overall performance.
Power BI Readiness Check
- Can you clean data before visualising it?
- Can you explain how the tables are related?
- Can you create and validate a basic measure?
- Can you choose a chart based on the question?
- Can you write an insight instead of repeating a number?
Stage 4 — Learn Python and Pandas for Repeatable Analysis
Python becomes useful when analysis needs to be repeated, automated or extended beyond a spreadsheet. It can help when data arrives in several files, the same cleaning process is required every month or custom transformations are needed.
Before working with Pandas columns, review Python variables and data types if you are unsure why numbers, text, dates and Boolean values behave differently during cleaning and calculation.
Python and Pandas Skills to Learn
- Variables and data types
- Conditions and loops
- Functions
- Lists and dictionaries
- Reading CSV and Excel files
- DataFrames
- Selecting and filtering data
- Missing-value handling
- Grouping and aggregation
- Merging datasets
- Date handling
- Basic charts and exported results
Before starting the assignment, use the Python development environment setup guide to prepare Python, VS Code or Jupyter Notebook and organise the project in a reusable workspace.
Learners who need mentor-led support with programming foundations can also review the Python training program before moving into Pandas-based analysis and automation.
Practical Python Assignment: Automated Monthly Sales Analysis
Divide the retail data into twelve monthly CSV files. Build a repeatable workflow that:
- Loads all monthly files.
- Combines them into one DataFrame.
- Standardises the column names.
- Corrects date and number formats.
- Handles missing values intentionally.
- Reviews and removes verified duplicates.
- Calculates monthly, category and city-level metrics.
- Creates two relevant charts.
- Exports a summary file.
- Produces a short findings note.
The official Pandas user guide is a useful reference when you need help with grouping, aggregation, merging and other DataFrame operations.
Python Readiness Check
- Can you load and inspect a dataset?
- Can you filter, group and summarise records?
- Can you merge two related datasets?
- Can you explain every transformation?
- Can you run the workflow again on updated data?
Stage 5 — Build Projects That Connect the Tools
A beginner should not start with a large project involving several unrelated datasets and advanced features. Build project depth gradually.
Level 1 — Tool-Specific Assignments
- Excel sales report
- SQL business-question set
- Power BI dashboard
- Python data-cleaning notebook
Level 2 — Combined Mini Project
Clean the retail data in Excel or Python, query orders and customers with SQL, build a Power BI dashboard and write five findings. This teaches you how the tools support different parts of the same analysis.
Level 3 — Documented End-to-End Project
Use the business problem: “Revenue increased, but average order value and profit declined. What changed?”
Your final project should contain:
- A clear problem statement
- The intended audience
- A dataset description
- Data-quality checks
- Documented cleaning decisions
- Defined metrics and analysis questions
- SQL queries or Python analysis
- A readable dashboard
- Written findings
- Limitations and assumptions
- Recommendations or next questions
- A README or project summary
- A short presentation
A dashboard is one project output. It is not the complete project unless you can explain the question, data, calculations, findings and limitations behind it.
College students who need more time for a major project, documentation and presentation can review the structure of the six-month Data Analytics industrial training. The page should be used to compare project depth, not as a guarantee of any employment outcome.
How Long Does It Take to Learn Data Analytics?
There is no single correct timeline. Progress depends on your starting level, weekly study time, assignment quality, access to feedback and ability to work without copying a tutorial.
- College student: Eight to twelve focused hours each week can support foundations, tool assignments and one combined beginner project.
- Working professional: Five to eight hours may require smaller weekly goals and a longer overall timeline.
- Industrial-training student: Twelve to eighteen hours may allow deeper documentation and major-project work.
- Complete non-technical beginner: More time may be needed for foundations, Excel and basic programming logic.
These are planning examples, not guaranteed completion timelines.
Can Data Analytics Be Learned in Three Months?
Three months can be enough to build structured beginner foundations when you complete regular assignments. A learner may cover data basics, Excel, SQL, Python and Pandas foundations, Power BI and one guided project.
However, finishing three months of videos is not the same as analysing an unfamiliar dataset independently. A stronger test is whether you can identify data problems, choose the right tool, verify your calculations and explain your decisions.
Learners considering a structured three-month path can compare the tool coverage and guided project scope on the three-month Data Analytics training page.
Common Data Analytics Learning Mistakes
Trying to Learn Every Tool Together
Do not begin Excel, SQL, Power BI, Tableau, Python, R, Machine Learning and cloud tools at the same time. Complete one useful output before adding another platform.
Watching Tutorials Without Independent Work
After following a tutorial, repeat the task with a different dataset. Change the questions, columns, calculations, visuals and findings. That is where you discover what you truly understand.
Copying Portfolio Projects
A guided project is useful for learning, but you should not present copied decisions as independent work. You must be able to explain why you selected the metrics, removed values, chose visuals and reached each conclusion.
Creating Dashboards Without Questions
A polished dashboard can still be unhelpful. Write the exact question each visual should answer before adding it to the page.
Trusting Results Without Validation
A query, formula or script is not correct only because it runs. Compare totals, inspect sample records, test assumptions and check whether the result answers the original question.
You can postpone for now: Machine Learning, Deep Learning, Spark, Kafka, multiple BI platforms, advanced cloud infrastructure and complex statistical modelling. These topics may matter later, but they are not required to begin the analyst learning path. Learners comparing the two paths can review Data Analytics and Data Science training.
Self-Learning or Structured Training: Which Approach Is Better?
Neither option is automatically better for every learner. The right choice depends on your discipline, available time and need for feedback.
| Factor | Self-Learning | Structured Training |
|---|---|---|
| Flexibility | High | Based on a batch or class schedule |
| Learning order | Planned by the learner | Usually organised in stages |
| Feedback | Must be found through peers or communities | May include mentor or classroom feedback |
| Assignments | Selected independently | Can be included in the learning plan |
| Project review | Must be arranged separately | May include guided review |
| Best suited for | Self-directed learners | Learners who need structure and accountability |
Self-learning can work well when you can plan a sequence, find suitable datasets, troubleshoot errors and review your work honestly. Structured learning may help when you keep changing courses, struggle to finish projects, need assignment feedback or require industrial-training guidance.
Students in Mohali, Chandigarh and nearby Tricity areas who prefer face-to-face support can compare classroom learning options without changing the educational purpose of this roadmap.
Not sure which learning path fits your current level? Compare the tools, assignments and project depth included in the Data Analytics learning programs before choosing a short foundation track or a longer project-based program.
What Should You Do After Reading This Roadmap?
Your next step should be a small completed analysis, not another list of tools to study.
- Choose one simple retail or e-commerce dataset.
- Write five questions the data can answer.
- Identify the first roadmap stage you cannot complete independently.
- Work on that stage only.
- Complete one practical output.
- Use the readiness checklist.
- Ask someone to review your work.
- Correct the mistakes before moving forward.
- Combine the tools only after the individual assignments are clear.
Final Learning Checklist
- Understand the structure of a dataset
- Identify common data-quality problems
- Clean and summarise spreadsheet data
- Write SQL queries for business questions
- Build a readable Power BI dashboard
- Analyse data using Pandas
- Validate calculations
- Write meaningful findings
- Explain assumptions and limitations
- Document and present a project
Frequently Asked Questions About the Data Analyst Roadmap
What should a beginner learn first for Data Analytics?
Start with business questions and data foundations. Learn what rows, columns, data types, metrics, missing values and duplicates mean. Then begin with Excel so you can see, clean, calculate and summarise data in one environment.
Should I learn Excel or SQL first?
Excel is usually easier for a complete beginner because the data and calculations are visible. Learn SQL next so you can retrieve, filter, group and connect data stored in related tables. Both skills are important.
Should I learn Power BI or Python first?
For learners focused on reporting and dashboards, Power BI can come before Python. It introduces transformation, modelling, measures and visual communication. Python can follow when you need flexible, repeatable or automated analysis.
Is Python compulsory for a data analyst?
Python is valuable and required in some analytics roles, especially for automation and larger workflows. Other reporting or business-intelligence roles may rely more on Excel, SQL and Power BI. Learn Python, but do not assume it must be your first tool.
Does Data Analytics require advanced mathematics?
Most beginner work requires basic numerical reasoning rather than advanced mathematics. You should understand percentages, averages, ratios, growth rates and introductory statistics. More advanced mathematics becomes relevant for specialised analysis and Data Science.
Can a non-technical student learn Data Analytics?
Yes. Begin with data foundations and Excel, then progress to SQL, Power BI and Python. Complete small assignments at every stage instead of trying to learn all tools together.
Can Data Analytics be learned in three months?
Three months can be enough to build beginner foundations and complete a guided project with consistent work. It does not guarantee mastery or employment. Measure progress by what you can complete and explain independently.
What projects should a beginner build?
Start with an Excel sales report, an SQL order analysis, a Power BI dashboard and a Python data-cleaning notebook. Then combine the relevant tools in one documented project with questions, cleaning decisions, findings, limitations and recommendations.
Final Thoughts on Following the Data Analyst Roadmap
A useful roadmap gives you a sequence, but your completed work proves whether the sequence is helping. Begin with a question, build one output at each stage and make sure you can explain every calculation and decision.
A beginner project does not need to be technically complicated. It needs to be accurate, clearly documented and genuinely understood by the person presenting it.
Explore Practical Data Analytics Training in Mohali
Compare course durations based on your current skill level, available time and the depth of project work you want to complete. Zestminds Academy offers offline classroom options covering Excel, SQL, Python, Pandas, Power BI, assignments and guided project work.
Table of Contents
- Why the learning order matters
- What a data analyst actually does
- The complete roadmap at a glance
- Stage 0: Business questions and data foundations
- Stage 1: Excel
- Stage 2: SQL
- Stage 3: Power BI
- Stage 4: Python and Pandas
- Stage 5: Projects and portfolio work
- Realistic learning timelines
- Common beginner mistakes
- Self-learning versus structured training
- Frequently asked questions
Mandeep Kaur
Stay Ahead with Expert Insights & Trends
Explore industry trends, expert analysis, and actionable strategies to drive success in AI, software development, and digital transformation.
Begin Your Journey to a Successful Tech Career
Talk to our mentors and choose the right training program.
Call us: +91-9056277961
Email us: hello@zestmindsacademy.com